With only one week left until the 2016 presidential election, citizens nationwide are preparing to cast ballots for their candidate of choice. The Emory Wheel distributed a survey Thursday, Oct. 20, to gauge the Emory community’s opinions of candidates and policy concerns in the 2016 election. Responses indicate Democratic candidate Hillary Clinton as the clear preference of those surveyed in the Emory community — a preference motivated more by fear that Republican candidate Donald Trump will win than by enthusiasm for Clinton’s victory.
Results are based on 2,533 completed surveys from 2,479 undergraduate and graduate students, 53 faculty and staff members and one respondent who did not answer.
The Process
The Wheel worked with College sophomores Allison Rose and Winston He from Emory’s Data Science Club, who used data collection and statistical analysis software Qualtrics to compile a 21-question survey on topics ranging from the trustworthiness of candidates to current issues this election season. Respondents picked from choices listed for each question. Survey results were kept anonymous.
The Wheel released the survey through an all-students email, which included both undergraduate and graduate students from each school at the University. The survey was pushed on Facebook and closed Thursday, Oct. 25.
The data reported is raw and has not been manipulated to account for sampling and response bias. Incomplete surveys were disregarded.
Candidate Preference
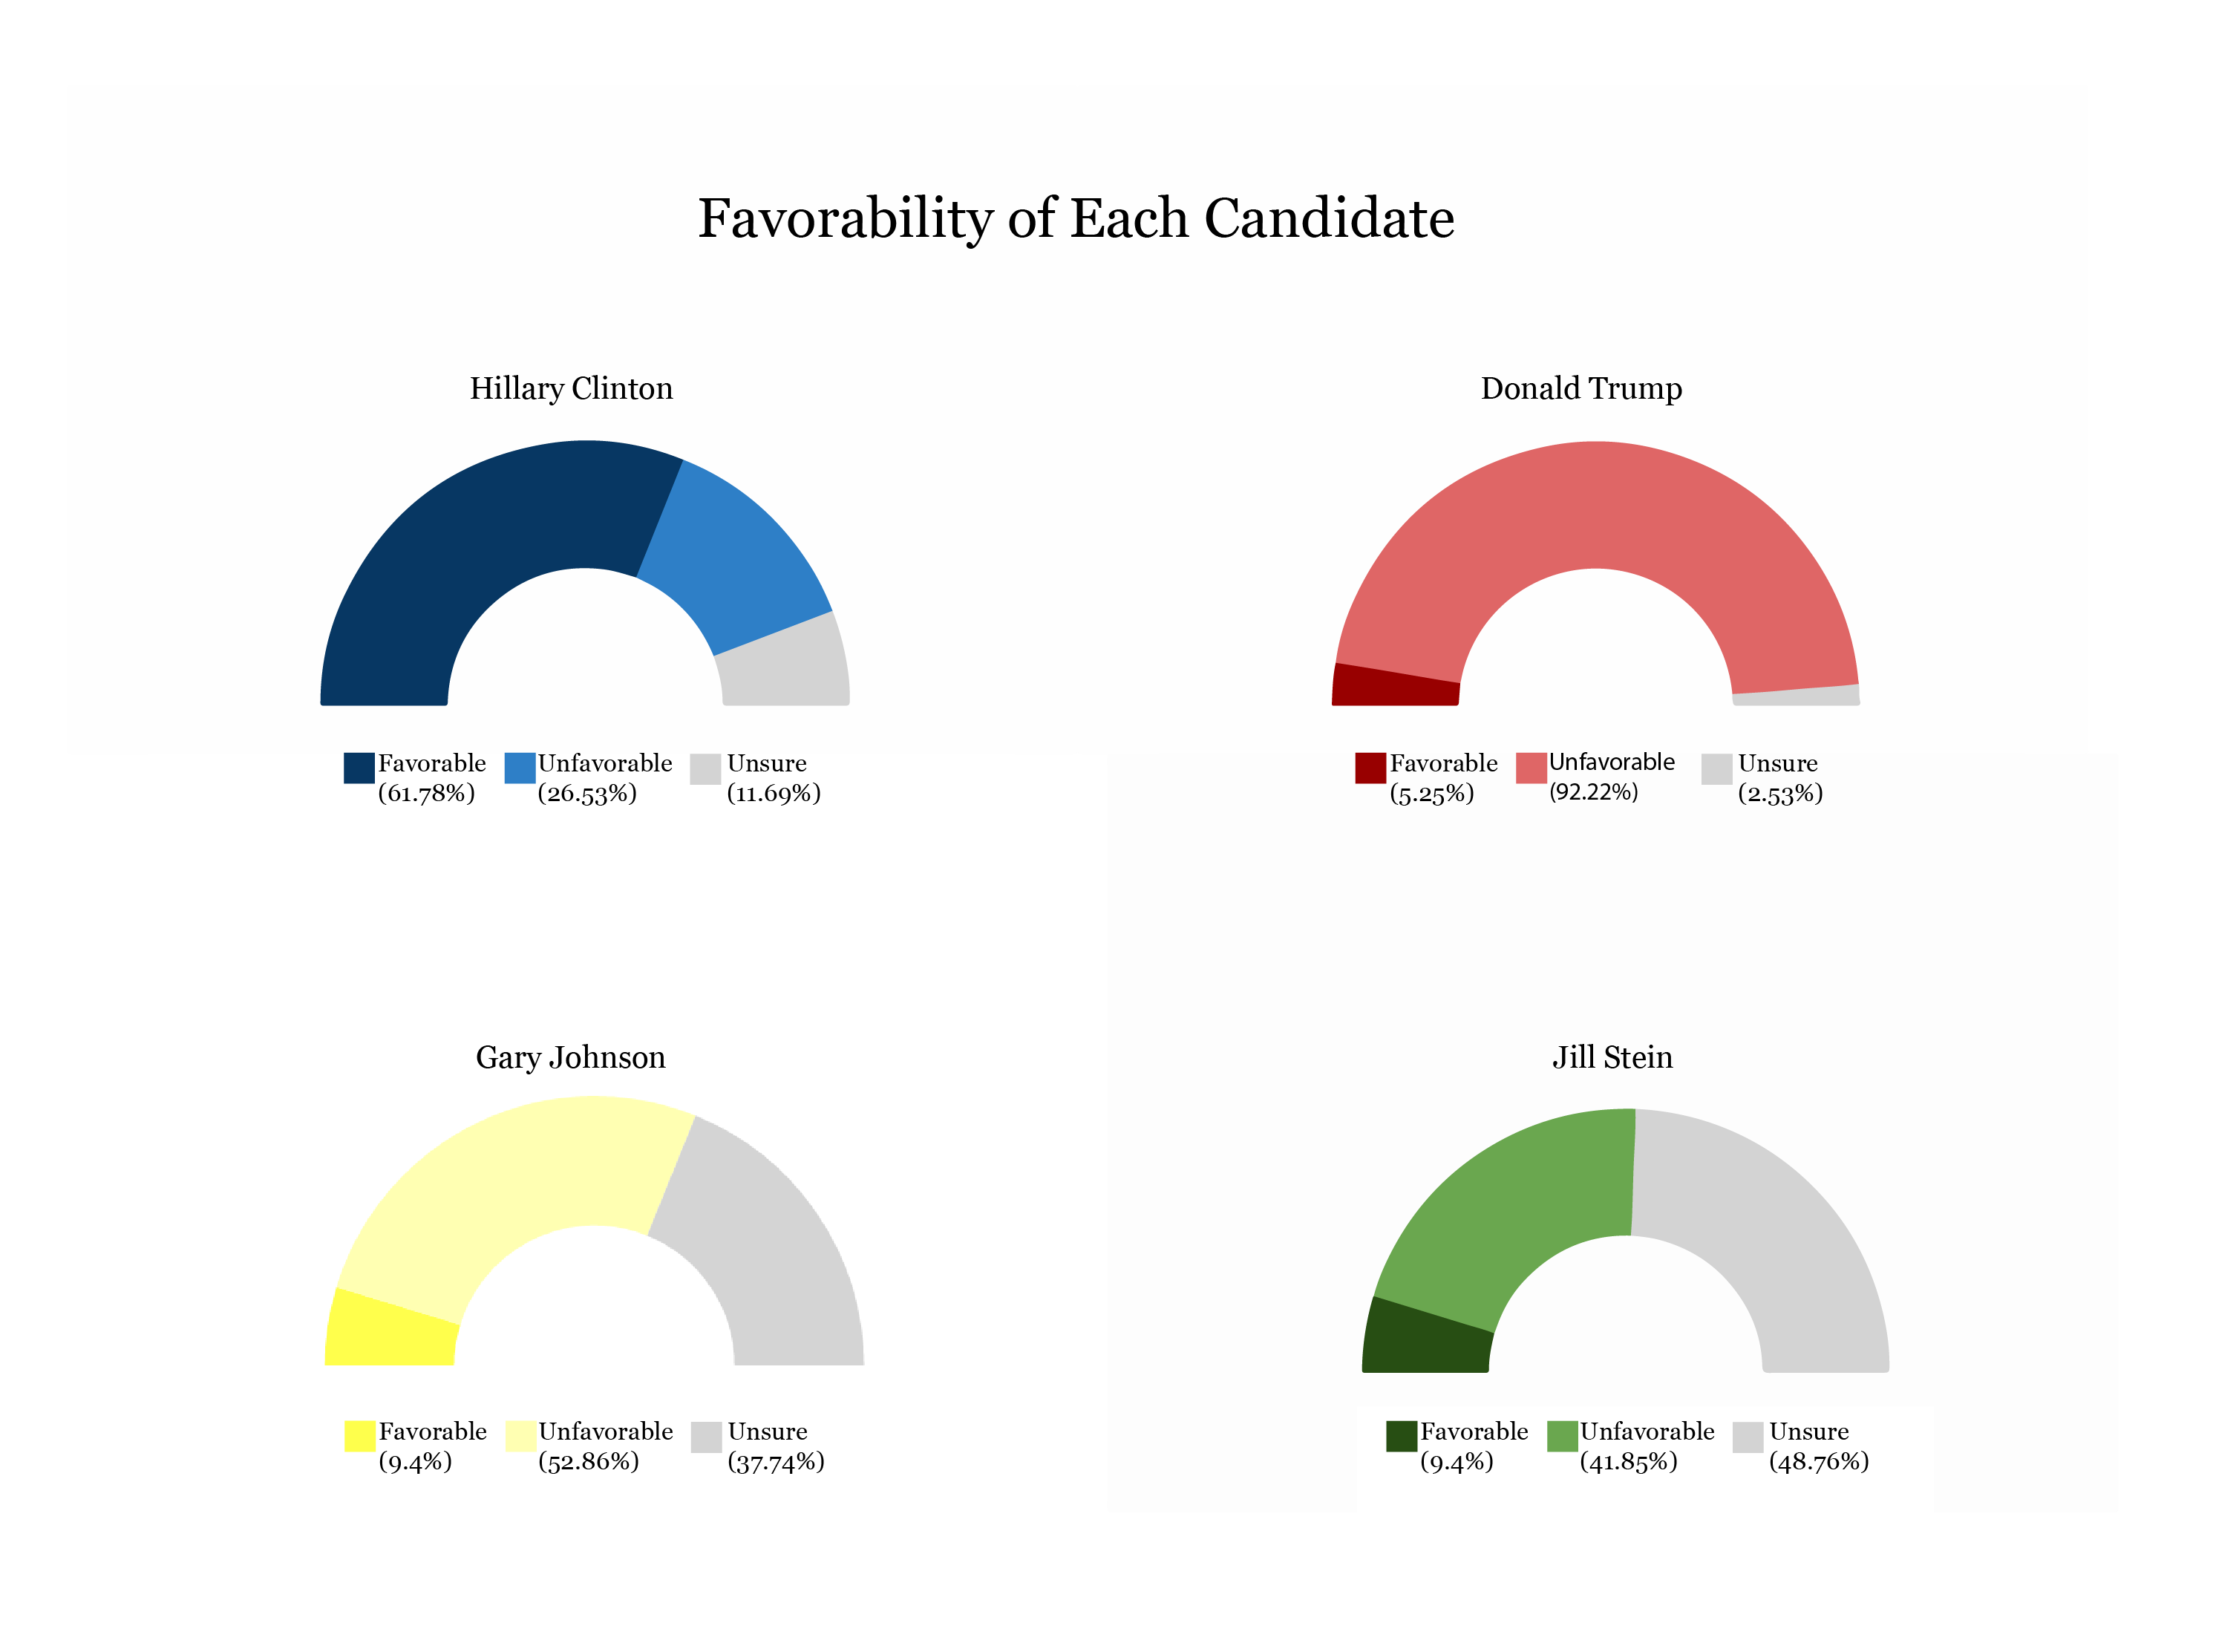
General political preferences of respondents indicated a clear partiality toward democratic politicians. When asked to evaluate politicians as favorable, unfavorable or unsure, 83 percent of respondents favored current Democratic President Barack Obama, whereas 62 percent of respondents favored Clinton. Opinions shifted drastically for Trump; 92 percent of respondents considered him unfavorable. Five percent, 133 respondents, viewed Trump favorably.
Compared to Trump, favorable responses were higher for both Green Party candidate Jill Stein and Libertarian Party candidate Gary Johnson at 9 percent each. Respondents also felt the most “unsure” about Stein and Johnson, with Stein at 49 percent and Johnson at 38 percent.
Elana Cates/Managing Editor
Respondents evaluated the trustworthiness on an ordinal scale of each presidential candidate. For Clinton, a plurality of 42 percent of respondents characterized her as “somewhat trustworthy,” while 79 percent of respondents characterized Trump as “very untrustworthy.” The majority of respondents reported that they “do not know” about Johnson’s and Stein’s trustworthiness.
When choosing to support either Clinton or Trump, respondents were more motivated by fear that the other candidate will win than enthusiasm for their respective candidate. The percentage difference between the motivations is 15 percent for Clinton supporters and 45 percent for Trump supporters.
If only Trump and Clinton had run for the presidency, 10 percent of respondents said that they would vote for the former, 83 percent would vote for the latter and 7 percent would not vote. If Trump won, 5 percent of respondents would be “very satisfied” or “somewhat satisfied,” while 71 percent would be “very satisfied” or “somewhat satisfied” with a Clinton victory.
Even the 442 respondents who identified as independent said that they would support Clinton 74 percent of the time.
Respondents affiliated with the Rollins School of Public Health had the largest percentage of Clinton supporters at 89 percent, while those affiliated with Oxford College had the largest percentage of Trump supporters at 14 percent.
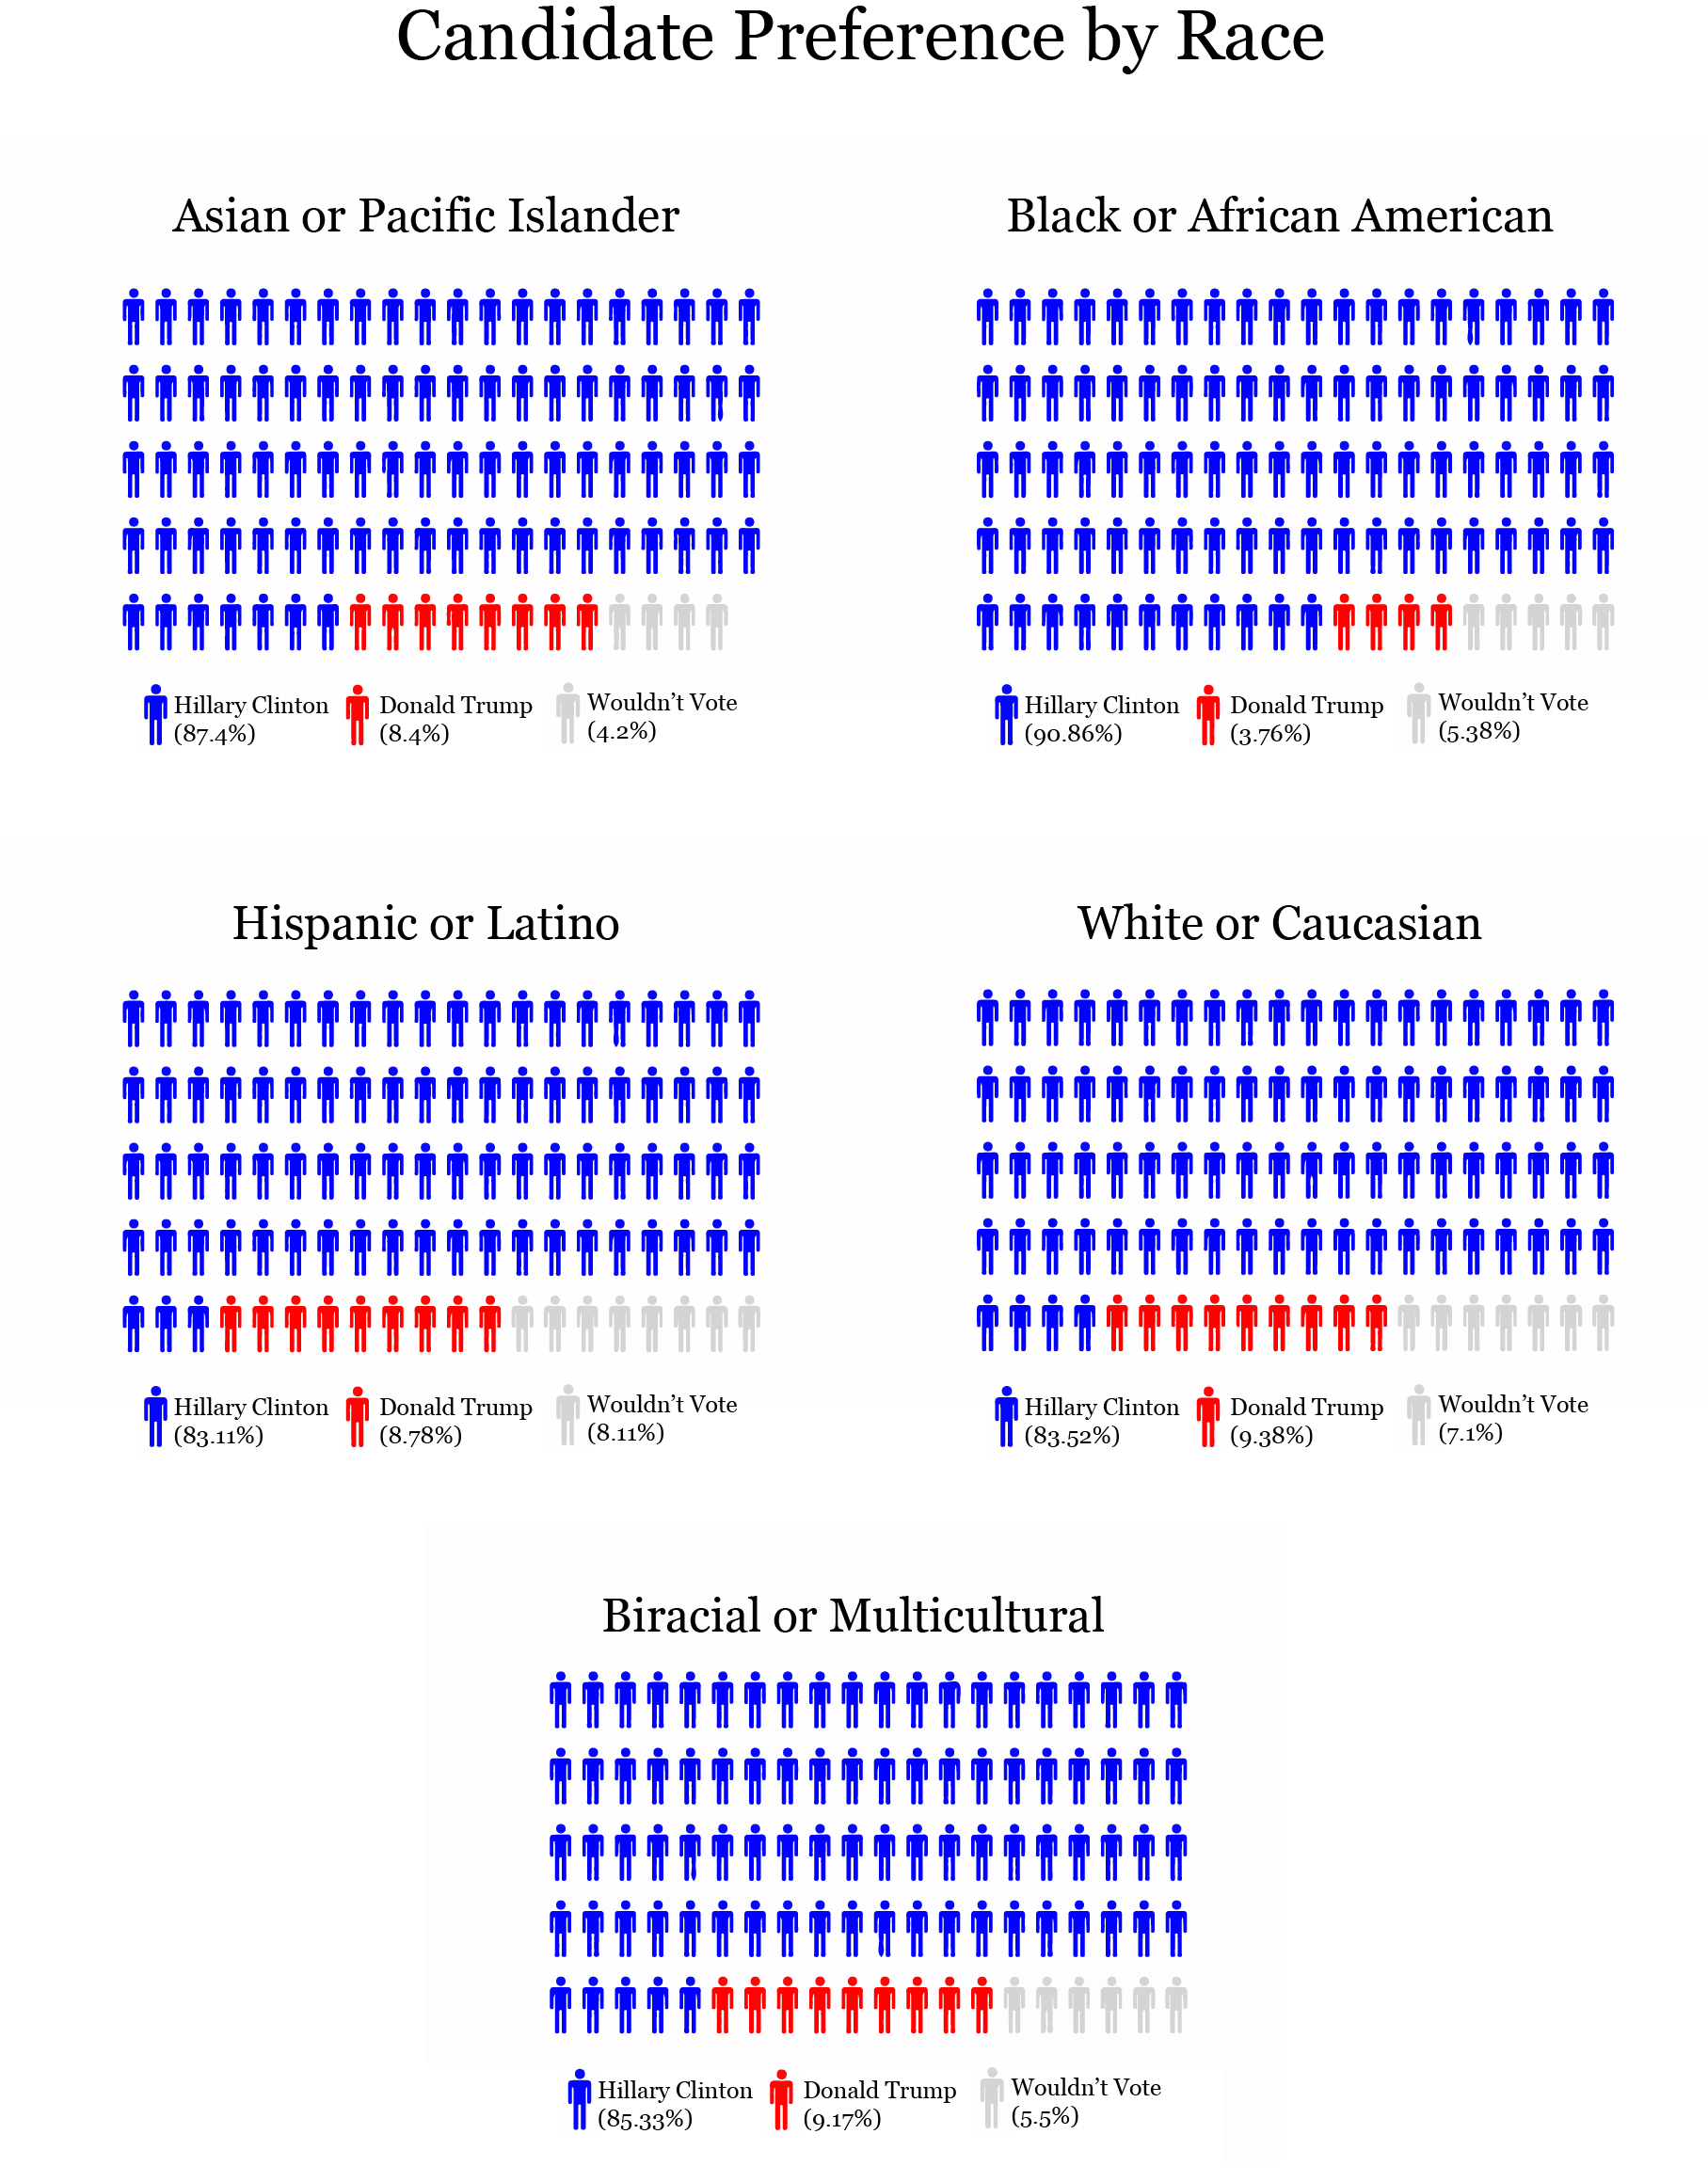
Similar to national trends, 91 percent of respondents who identified as black or African American supported Clinton.
Elana Cates/Managing Editor
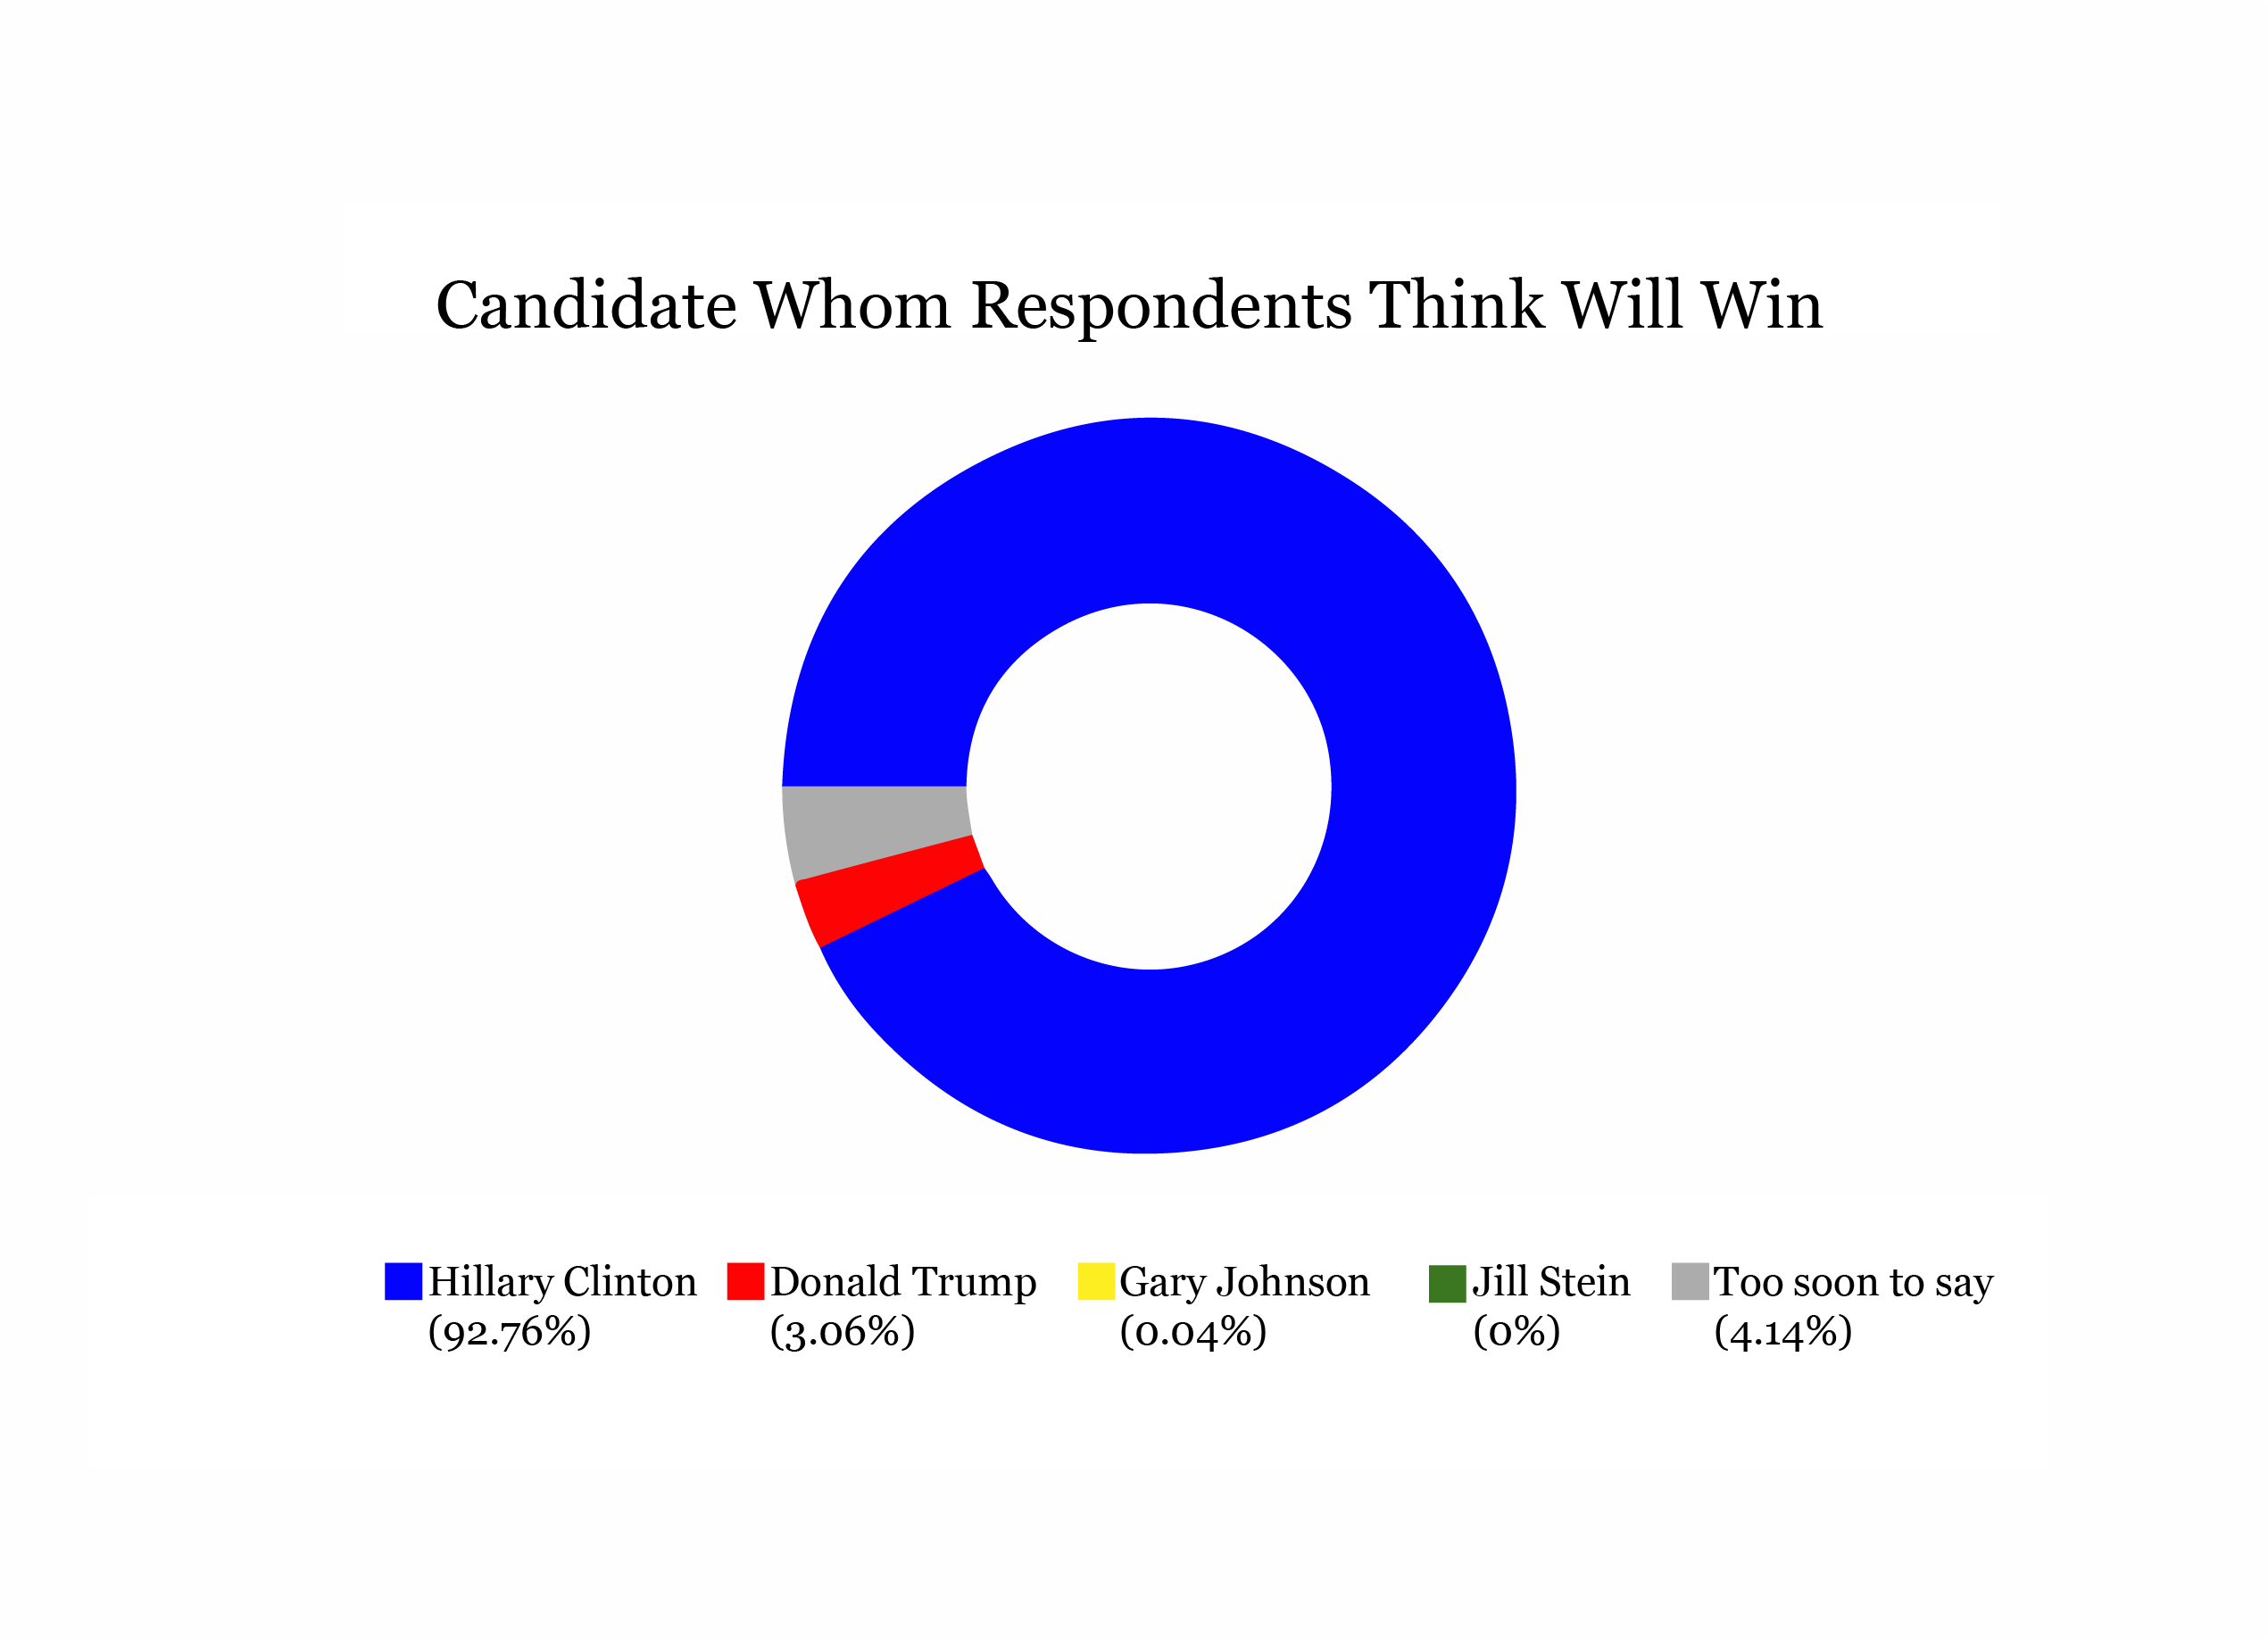
Despite which candidate respondents support, the majority believed Clinton will win the election, while 4 percent believed last week was “too soon to say.”
Approximately 90 percent, or 2,293 respondents, are registered voters, and 63 percent said they are “very interested” in the presidential election.
Elana Cates/Managing Editor
National Policy Concerns
Each respondent chose three of 11 issues that they deemed the most important this election season. The most popular responses were economy and jobs at 19 percent, foreign policy at 14 percent and race relations at 14 percent. Respondents who identified as black or African American consistently chose race relations as one of their most important issues.
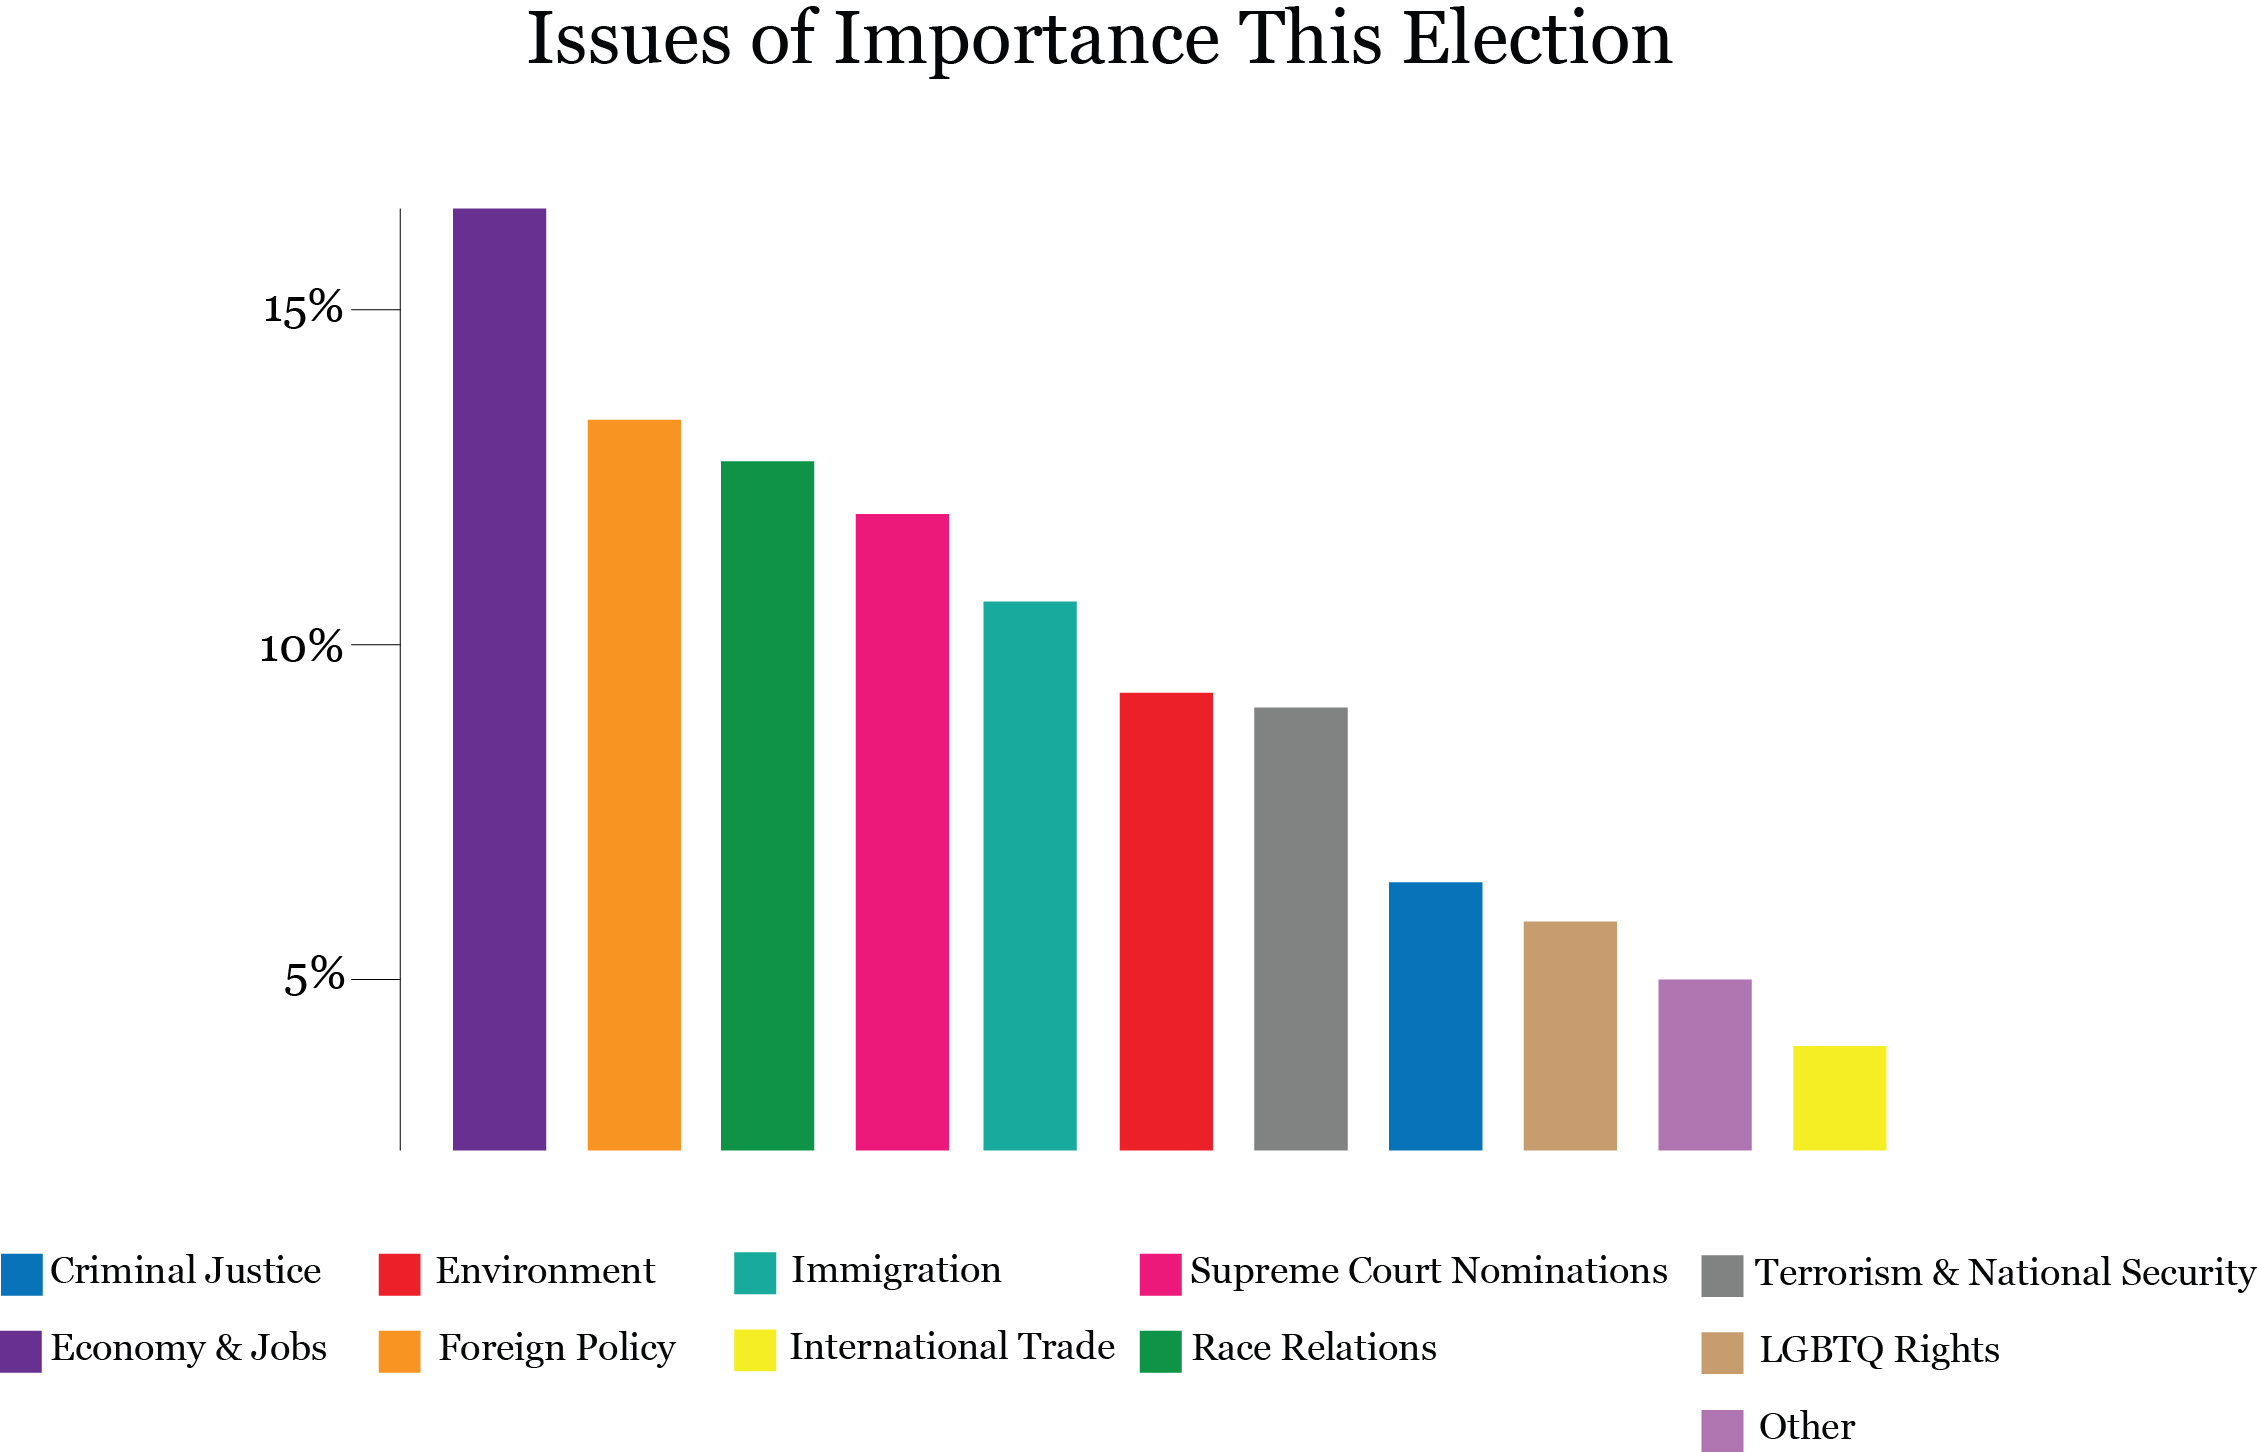
Elana Cates/Managing Editor
When the Wheel stratified those responses by party, Democratic respondents were most concerned with the economy and jobs, race relations and Supreme Court nominations. Republican respondents were most concerned with the economy and jobs, terrorism and national security and U.S. foreign policy.
The majority of Clinton’s supporters reported most concern for the economy and jobs, race relations and U.S. foreign policy. Trump supporters’ concerns remained the same as those of Republican respondents.

Elana Cates/Managing Editor
The Respondents
Of the respondents, 15.1 percent identified as conservative or slightly conservative, 18.3 identified as moderate and 65 percent identified as liberal or slightly liberal.
The majority, or 61 percent, of respondents identified as female. The remainder identified as male (35 percent), non-binary (0.4 percent) and transgender (0.2 percent). Nearly 3 percent preferred not to answer.
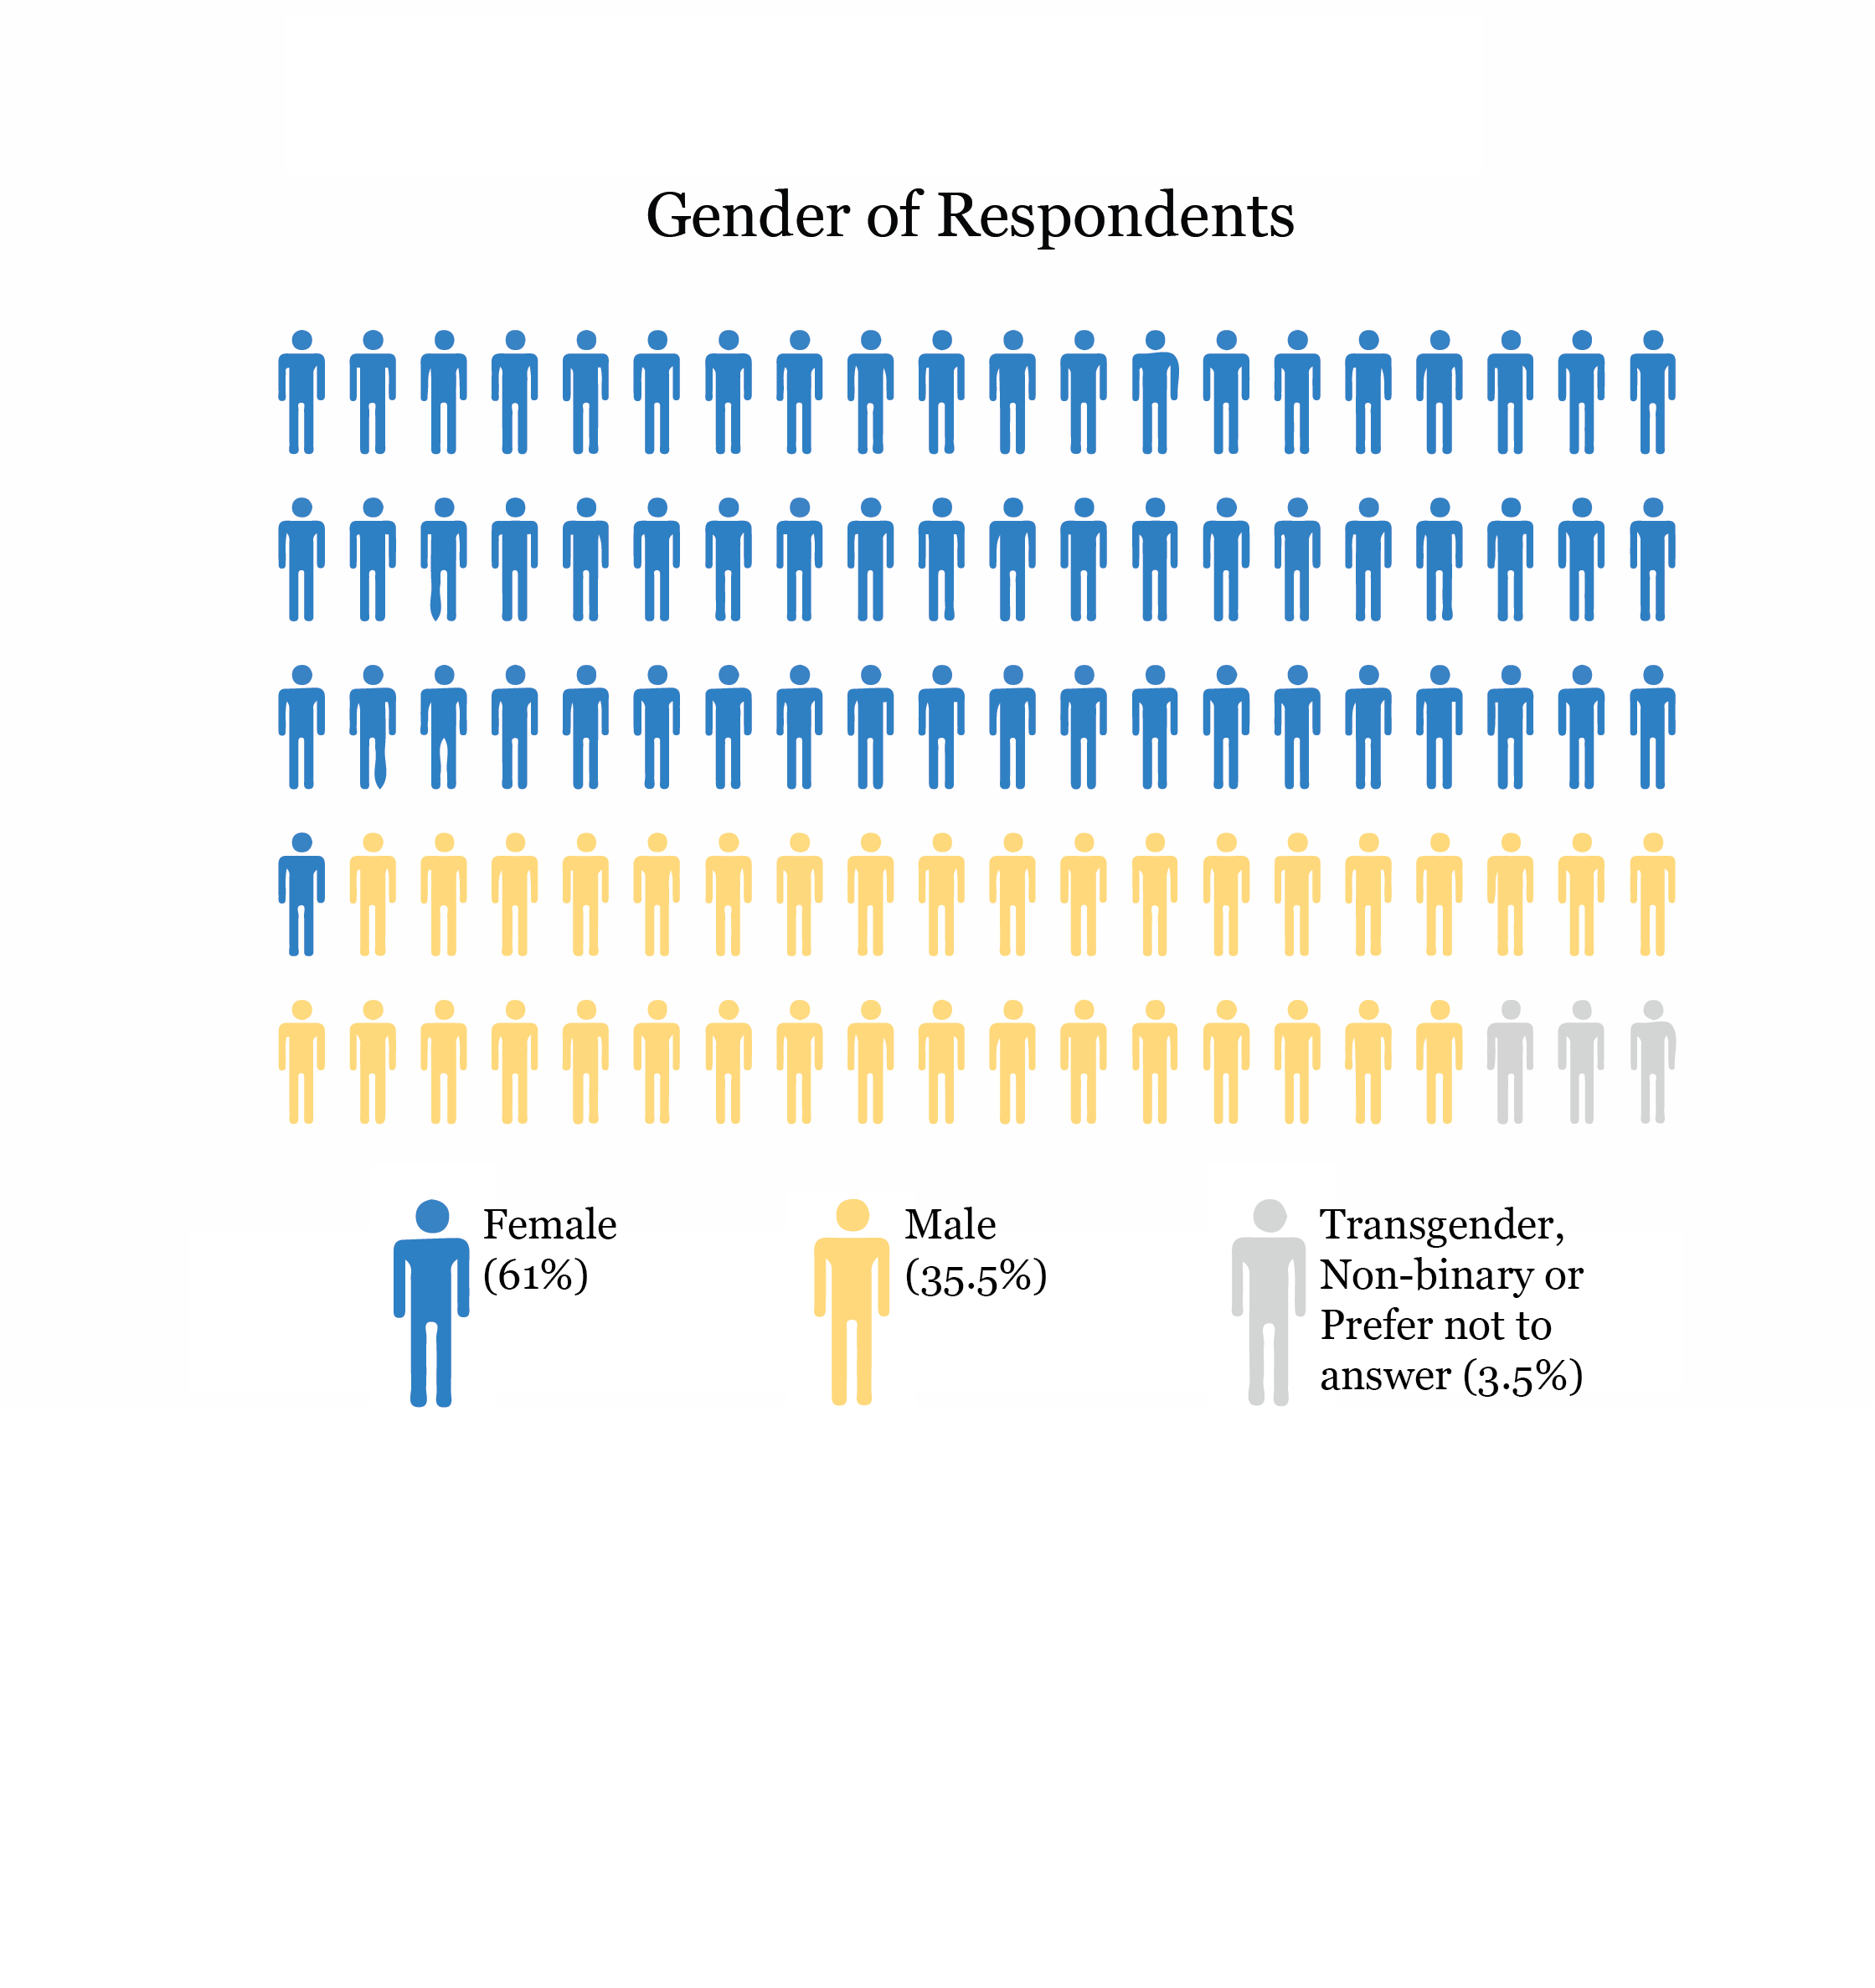
Elana Cates/Managing Editor
Of all undergraduates, the majority, or 61 percent, identified as white or Caucasian; 15.1 percent identified as Asian or Pacific Islander; 7.4 percent identified as black or African American; 5.9 percent identified as Hispanic or Latino; 4.3 percent identified as biracial and 0.2 percent identified as Native American or American Indian. 1.2 percent identified as other, and 4.8 percent preferred not to reveal their race.
anwesha.guha@emory.edu | Anwesha Guha (18C) is from Montgomery, Ala., majoring in English and quantitative science with a concentration in biology. She served most recently as news editor. In addition to the Wheel, she researches and tutors.