The Emory Wheel’s Diversity, Equity and Inclusion (DEI) task force distributed its fifth annual demographic survey to assess inclusivity and representation in the newsroom. The task force asked contributors about their identities and experiences in the Wheel’s work environment. The DEI task force uses these results to develop and implement initiatives that address inequalities within the organization.
Methodology
The task force emailed the demographic survey to the 130 students who contributed to the Wheel during the 2024 calendar year, marking a decrease from last year's 176 contributors. Of the 130 students, 68 responded, yielding a 52.3% response rate. This was 1.7 percentage points greater than 2024’s 50.6% response rate. All responses were kept anonymous.
There are limitations to this data, as 47.7% of students who qualified to take the survey did not complete the form, limiting the task force's ability to ensure fully representative data.
Editors constituted the largest number of respondents at 38.2%. Wheel contributors — students who produced less than five articles, photographs or illustrations — made up 27.9% of the respondents. Lastly, staff members who published five or more pieces of work followed at 16.2%.
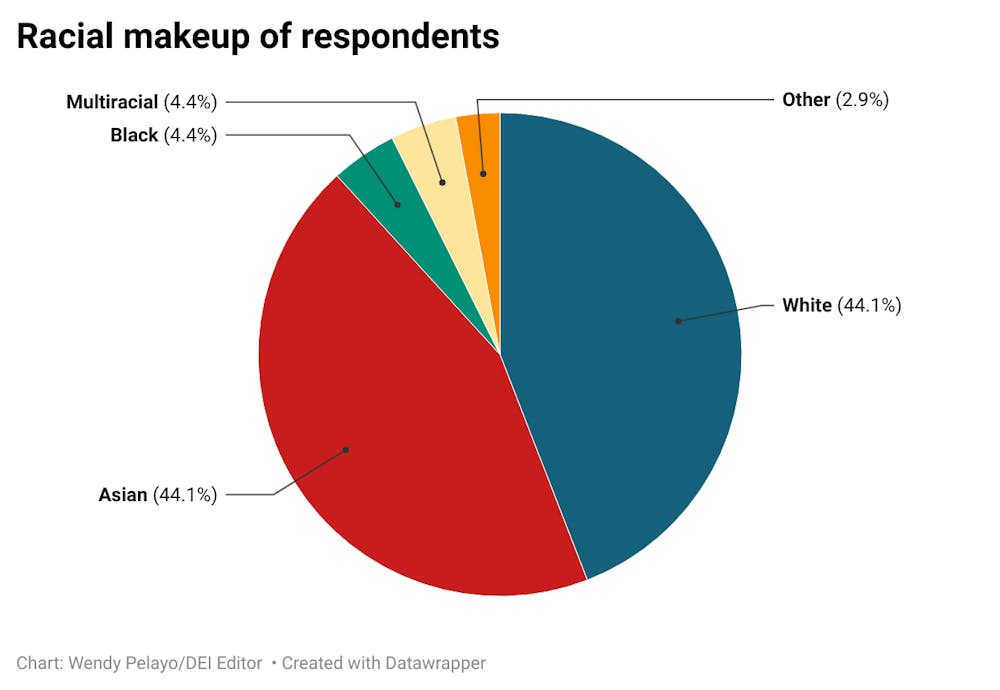
Race visualization:

Latinx visualization:


In the past, if a respondent selected multiple races, the Wheel counted them twice — once for each race. However, this year the task force decided to create a “multiracial” category to avoid misrepresenting respondents’ identities.
Under this new categorization system, 44.1% of respondents identified as white and another 44.1% of respondents identified as Asian. Under the previous categorization system, 53.9% of respondents identified as white in 2024 and 56.5% did so in 2023. According to the Office of Planning and Administration, 29.3% of all undergraduate students enrolled in fall 2024 were white and 25.8% were Asian. Of the 5.88% of participants who selected multiple races, all selected white or Asian as at least one aspect of their identity.
The Wheel continues to lack Black or African American representation, with only 4.4% of respondents identifying as such. Under the previous categorization system, 6.7% of respondents identified as Black in 2024, while 3.2% identified as Black in 2023. Further, 4.4% of respondents also identified as Latinx this year, while 5.6% and 1.6% identified as Latinx in 2024 and 2023, respectively. According to the Office of Planning and Administration, 9.9% of undergraduate students identify as Black or African American while 11.8% identify as Hispanic or Latino, demonstrating a continued underrepresentation of these groups in the Wheel’s newsroom.
Gender identity visualization:

The majority of respondents were cisgender women at 61.8%. This marks a continuing decline from 2024 and 2023, when 69.7% and 78.7% of respondents identified as cisgender women, respectively. The proportion of cisgender men, 26.5%, increased from 22.5% in 2024 and 13.1% in 2023. The percentage of respondents identifying as nonbinary, 2.9%, marks a decrease from 4.5% in 2024 and 4.9% in 2023.While cisgender women continue to dominate the gender composition of the Wheel, 2025 represents a more balanced distribution in gender identity compared to previous years.
Sexual orientation visualization:

Similar to the new approach to analyze the Wheel’s racial demographics, the task force decided to establish a “multiple sexual orientations” category to avoid misrepresenting respondents who feel more than one label best represents their identity. Under this new categorization process, 11.8% of respondents selected multiple sexual orientations.
This year, 51.5% of respondents identified as only heterosexual. Though a slightly different methodology, this suggests at least a slight decline from the 66.3% of heterosexual respondents in 2024 and the 56.5% in 2023. Bisexual, the second most common sexual orientation in the prior two years, followed at 16.2% this year. Respondents who identified as gay and queer each made up 4.4% of the students who completed the survey. Lastly, lesbians comprised 2.9% of the respondents.
First-generation status visualization:

This year, 7.4% of respondents identified as first-generation college students. This percentage is slightly greater than the 6.7% of respondents who identified as first-generation in 2024 but smaller than the 7.9% who did so in 2023. According to the Office of Planning and Administration, 14.4% of undergraduate students identified as first-generation in fall 2024. Therefore, this year’s survey underscores a consistent lack of representation of first-generation students at the Wheel as they remain under 10% of respondents.
Low-income status visualization:

In this year’s survey, 13.2% of respondents identified as low-income. This is similar to 2024, when 13.5% of respondents identified as low-income, but a slight increase from the 11.1% who reported the same in 2023. Further, 32.4% of this year’s respondents receive need-based aid and 30.9% of respondents are federal work-study students. Comparatively, the Office of Undergraduate Admission reports that 52% of undergraduate students receive financial assistance, highlighting consistent underrepresentation of low-income students on the Wheel.
Disability status visualization:

This year, 8.8% of respondents identified as disabled or indicated that they are registered with the Department of Accessibility Services. This is consistent with 9% in 2024 but lower than 19.4% in 2023.
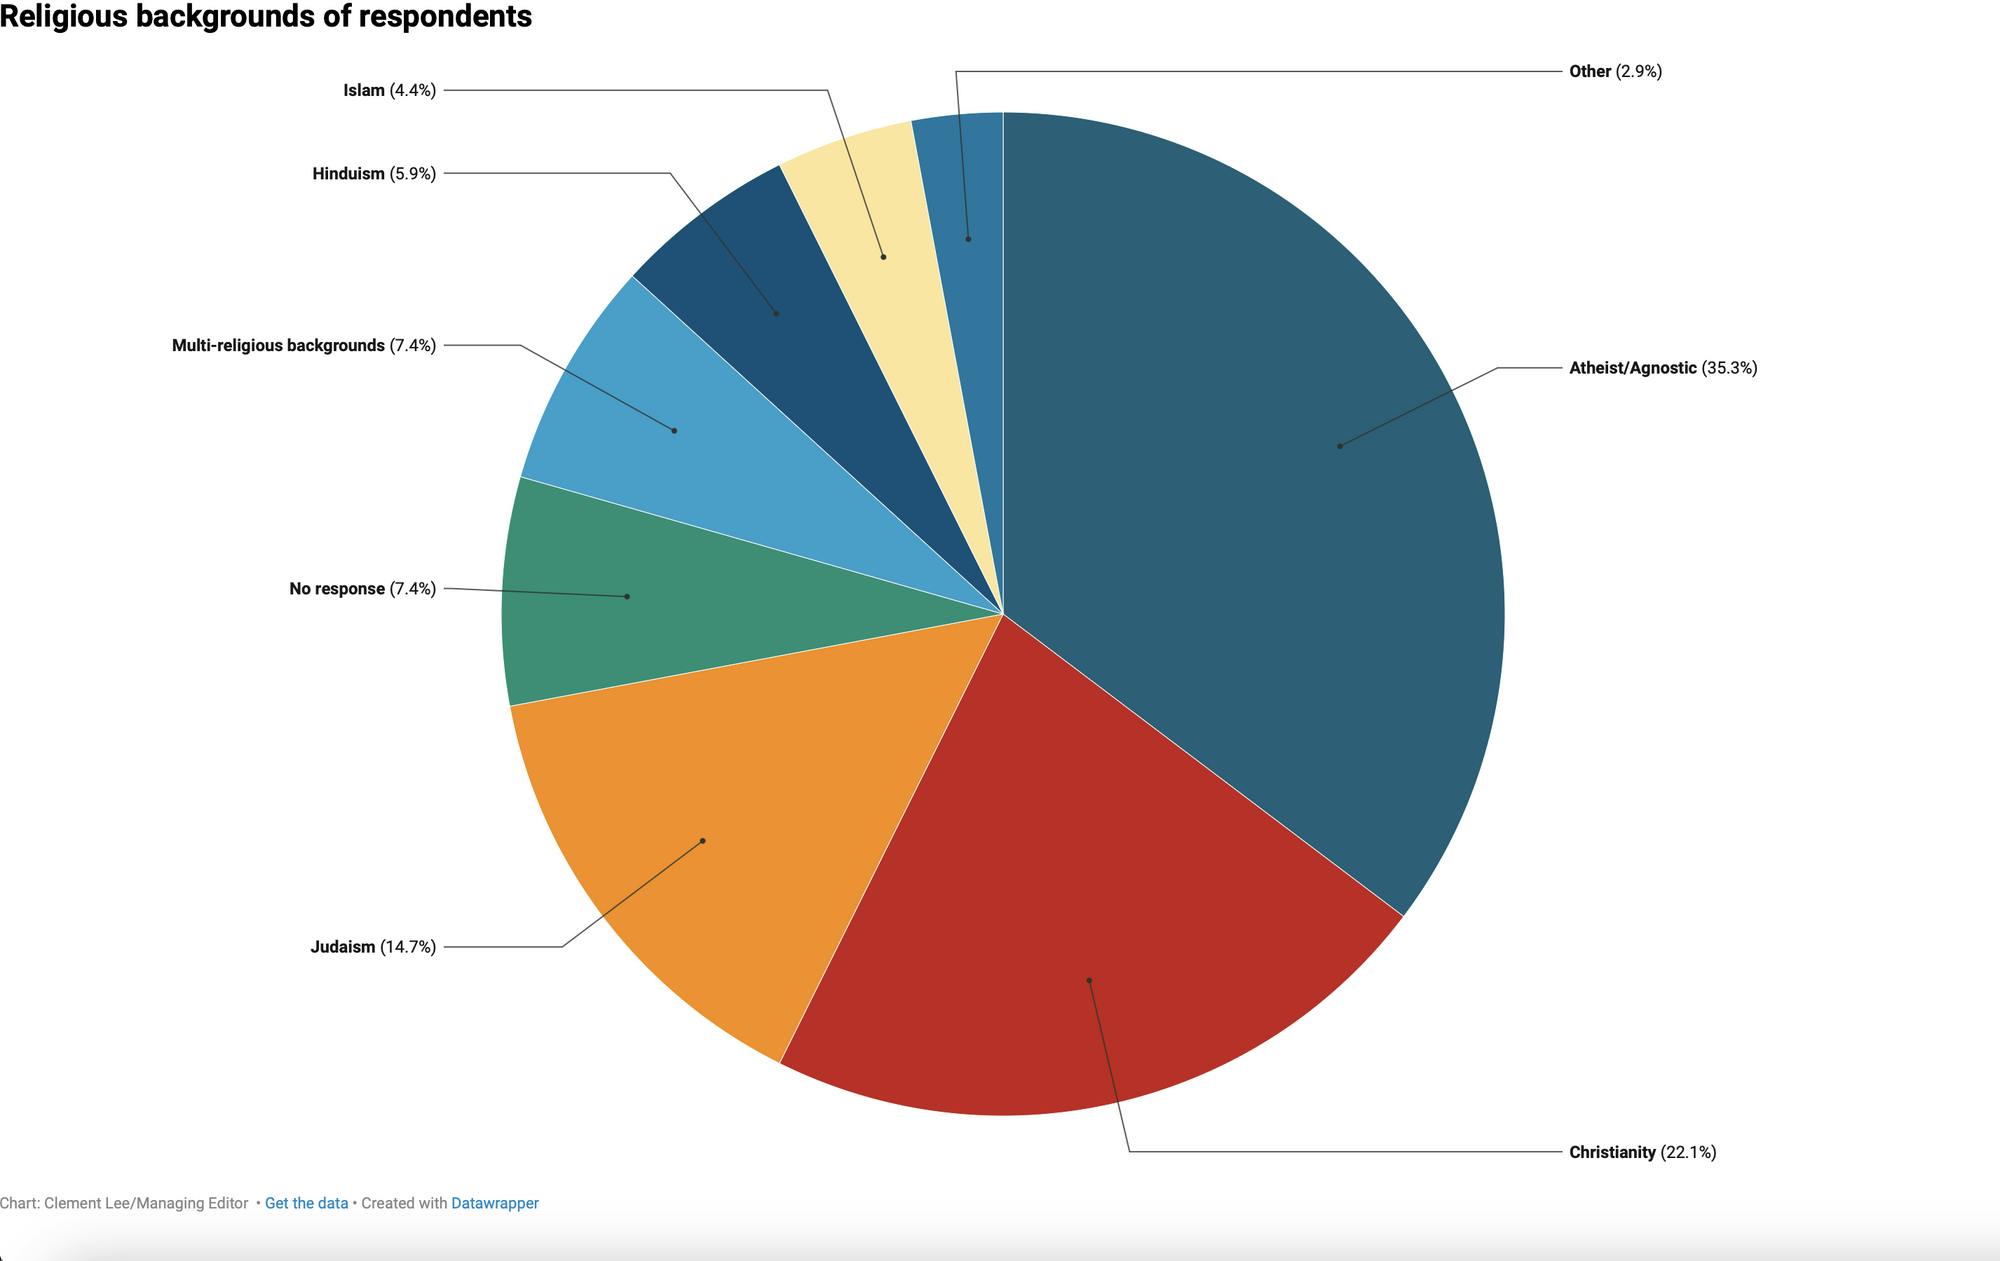
Religious background is a new category added to the 2025 report and is therefore not comparable to previous years. The majority of respondents reported that they were either atheist or agnostic at 35.3%, with Christianity following at 22.1% and Judaism coming in third at 14.7%.
Wheel culture
Reflecting sentiments expressed in the Wheel’s 2024 Demographic Report, respondents of the 2025 demographic survey noted that the Wheel’s culture was “welcoming.” Others responded that the environment was also “fun” and “inclusive.”
However, others noted that the Wheel’s culture could be “intimidating” and “overly serious.” Respondents also expressed concerns about the Wheel being too cliquey and bureaucratic. One contributor mentioned siloed communication from the top down, writing that the culture tends to be “exclusive” and does not “expand to staff or contributors.”
Many respondents suggested that members of the Wheel should reach out to different student organizations and underrepresented groups on campus to diversify the voices featured in their coverage. One contributor shared concerns about distrust in the Wheel following content published about the Israel-Palestine conflict. Another respondent expressed concern about the lack of conservative voices on the Wheel.
DEI efforts
The task force aims to ensure an inclusive and accessible environment at the Wheel that equitably represents the student body at Emory University.
This year, increasing the representation of historically underrepresented communities on campus, particularly Black and Latinx contributors, has been a key focus of the Wheel’s recruitment initiatives. The task force spent time this year building the foundation for collaboration with the Belonging and Community Justice centers on campus and journalism workshops. This March, the task force will host a journalism education workshop entitled “Spinning Stories,” which will provide information on how to get involved with the Wheel, highlight professional journalists of color and offer interactive learning activities.
Simultaneously, the DEI task force has tracked the content published in each print edition to recognize trends in coverage and determine which topics need more attention. This year’s content tracker was improved from last year’s to include more readily available data and be more digestible for editors. In the future, the task force hopes to publish the content trackers on the Wheel’s website.
The DEI task force also plans to create centralized communication networks, such as a Slack channel, where interested student organizations can contact the Wheel about coverage concerns, story ideas and leadership updates.
The task force aims to improve the diversity of the Wheel’s coverage, create equal opportunities for all contributors regardless of background and improve the overall culture of the newspaper. This demographic report lies at the core of what the taskforce aims to accomplish by ensuring the utmost openness and transparency of the Wheel’s internal operations.
The task force encourages any member of the Emory community to reach out with questions or feedback at emorywheeldei@gmail.com.
Managing Editor Clement Lee (24Ox, 26B), DEI Editor Wendy Pelayo (26C), Kayley Kim (26Ox, 28C), Kristen Seo (28C), Kunjal Kothari (28C) and Halle Wulff (24Ox, 26C) contributed to this report.